Progressive Car Accident Claims NYC: 2025 Complaint Data
Progressive car accident claims NYC follow a more inconsistent pattern than other major carriers — here’s what New York’s own regulatory data, and Bronx litigation experience, show.
Quick answer: Progressive’s New York complaint record is the most inconsistent of the major carriers — ratios range from 0.0061 to 0.1224 depending on which Progressive entity underwrote the policy, per 2025 NY DFS data.
In Bronx litigation, attorneys commonly report Progressive as more willing than other major carriers to litigate rather than settle at plaintiff-favorable values — this is practitioner observation, not a state-published statistic.
Funding implication: plan for a longer timeline, particularly in contested-liability or higher-severity Bronx cases.
If Progressive is the carrier on the other side of your New York City car accident case, here’s what the regulatory data shows — and what attorneys who litigate against Progressive in the Bronx regularly observe.
What the New York State Data Shows
The NY Department of Financial Services tracks upheld consumer complaints per $1 million in premiums written. Progressive writes New York auto policies through multiple underwriting entities, and unlike GEICO or State Farm, those entities show sharply different complaint profiles in the 2025 ranking (complaints closed in 2024):
| Progressive Entity | Complaint Ratio | Rank (of 128) | Total Complaints |
|---|---|---|---|
| Progressive Specialty Insurance Co. | 0.0061 | 48th | 74 |
| Progressive Advanced Insurance Co. | 0.0157 | 57th | 222 |
| Progressive Max Insurance Co. | 0.0176 | 61st | 91 |
| Progressive Northwestern Insurance Co. | 0.0221 | 62nd | 13 |
| Progressive Casualty Insurance Co. | 0.0585 | 85th | 241 |
| Progressive Direct Insurance Co. | 0.1224 | 101st | 87 |
Source: NY Department of Financial Services, 2025 Automobile Insurance Complaint Ranking Report (complaints closed in 2024). Lower ratio = fewer upheld complaints per $1M in premiums written. Statewide average across all 128 ranked entities: 0.0341.
This is a wider spread than either GEICO or State Farm shows across their respective entities. Progressive Direct’s ratio (0.1224) is roughly 20 times higher than Progressive Specialty’s (0.0061). For a plaintiff, this means the specific Progressive entity named on your declarations page matters more than it would with a more uniform carrier — though the policy paperwork rarely makes this distinction obvious without an attorney reviewing it.
What Attorneys See in Bronx Litigation
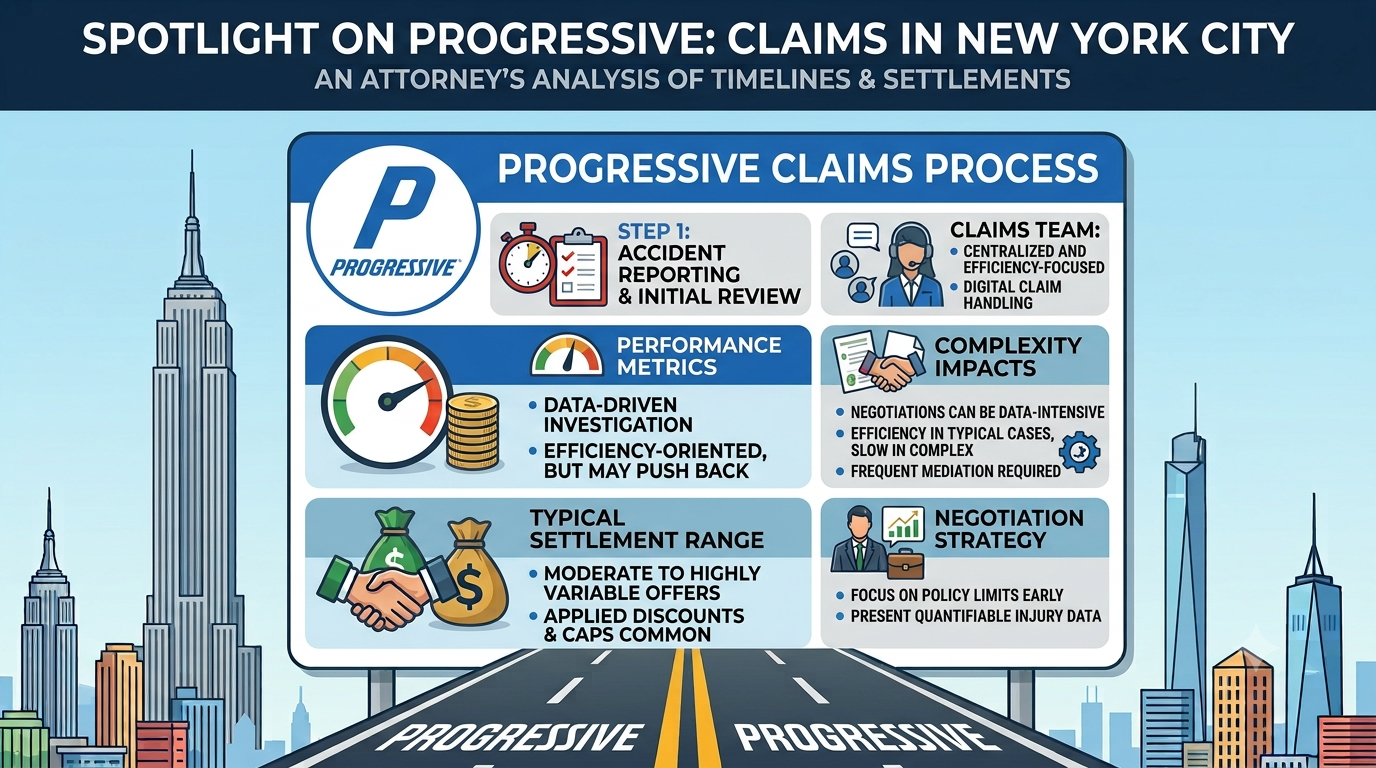
The following reflects practitioner observation from active Bronx personal injury litigation, not state-published statistics. In high-exposure venues like the Bronx, Progressive has a reputation among plaintiff attorneys for being more willing than GEICO or State Farm to push a case toward independent medical examinations (IMEs), contest medical causation, and proceed toward trial rather than settle early at plaintiff-favorable values.
This litigation posture does not show up in the DFS complaint data — fighting a claim through proper IME and discovery channels, even aggressively, is not the kind of conduct that generates upheld consumer complaints. It’s a separate dimension from regulatory compliance: a carrier can have a clean complaint record and still be a difficult, slow-moving litigant.
Funding Considerations in a Progressive Case
If Progressive is the carrier on a Bronx case with contested liability or a disputed injury severity, a realistic timeline assumption matters more than it would with a faster-settling carrier. Plaintiffs relying on pre-settlement funding in this scenario should plan for an extended timeline — in practitioner experience, sometimes 24 to 36 months before resolution in contested Bronx cases — which is a material factor in evaluating whether funding makes economic sense given the expected advance size and rate.
Run your numbers: the just.law estimator factors carrier, venue, and injury type together to project a timeline range and funding eligibility score specific to your case — not a generic industry average.
A Note on Source Data
The complaint ratios above come directly from the New York DFS’s published annual report and reflect upheld complaints only. The Bronx litigation observations in this article reflect practitioner experience in active plaintiff personal injury litigation and are presented as such — they are not a substitute for state-published data and should not be read as a quantified statistic.